

Contact centers generate some of the most valuable data in an organization. Every call, chat, email, transfer, escalation, and self-service interaction contains signals about customer needs, operational friction, agent performance, product issues, and business risk.
But many organizations still struggle to turn that activity into action. Call center reporting may be fragmented across systems. Contact center performance metrics may be defined differently by different teams. Contact center dashboards may show what happened without explaining why it happened. Leaders may have plenty of data, but not the insight they need to make confident decisions.
That is where contact center analytics and reporting become critical.
When built correctly, contact center reporting gives leaders visibility into performance. Contact center analytics goes a step further by helping teams understand root causes, predict future needs, and prioritize the changes that will improve customer experience and operational efficiency. At Kenway Consulting, we help organizations move beyond static reporting and disconnected contact center dashboards. We work with clients to design the data foundation, reporting structure, analytics strategy, and operating model needed to turn contact center data into measurable business value.
Contact center reporting is the process of collecting, organizing, and presenting contact center data so leaders and teams can understand how the operation is performing. Effective call center reporting helps organizations monitor trends, track service levels, and evaluate overall contact center performance.
Reporting typically answers questions such as:
Strong contact center reporting helps organizations move from anecdotal decision-making to objective performance management. Instead of relying only on intuition, leaders can use data to identify trends, monitor service levels, evaluate staffing needs, track customer experience, and prioritize improvement opportunities through more reliable contact center performance metrics and reporting insights.
Reporting is especially valuable when teams need consistent visibility into daily, weekly, monthly, or executive-level performance. It creates a shared source of truth for what happened across the contact center and supports more effective contact center dashboards and operational reporting.
Contact center analytics is the broader discipline of using contact center data to generate insights, explain performance, and guide future decisions.
While reporting often focuses on historical performance, call center analytics helps teams understand why performance is changing, what may happen next, and what actions the business should take.
For example:
Or:
Contact center analytics helps organizations improve customer satisfaction, reduce operational cost, optimize staffing, identify training needs, measure self-service performance, support compliance, and prioritize technology investments.
The most effective organizations do not treat analytics as a separate reporting exercise. They use it as a management discipline that connects data, operations, customer experience, technology, and strategy while supporting stronger decision-making through reporting, analytics, and contact center performance metrics.
Reporting and analytics are closely related, but they are not the same.
| Area | Contact Center Reporting | Contact Center Analytics |
| Primary question | What happened? | Why did it happen, what will happen next, and what should we do? |
| Typical use | Performance monitoring | Root-cause analysis and decision support |
| Time horizon | Historical and current-state | Historical, real-time, predictive, and prescriptive |
| Output | Reports, dashboards, scorecards | Insights, recommendations, forecasts, and action plans |
| Example | Call volume increased 12% this month | Volume increased because billing-related contacts spiked after a policy change |
| Business value | Visibility and accountability | Improved decisions and measurable performance improvement |
A mature contact center needs both. Reporting creates the baseline. Analytics turns the baseline into action and helps organizations make more informed decisions using reporting insights and contact center performance metrics.
Contact center leaders are under constant pressure to improve customer experience while managing cost, staffing, technology complexity, and service expectations. Without reliable reporting and analytics, those decisions become harder than they need to be.
A strong analytics and reporting capability can help organizations:
The goal is not to create more contact center dashboards. The goal is to create better decisions.
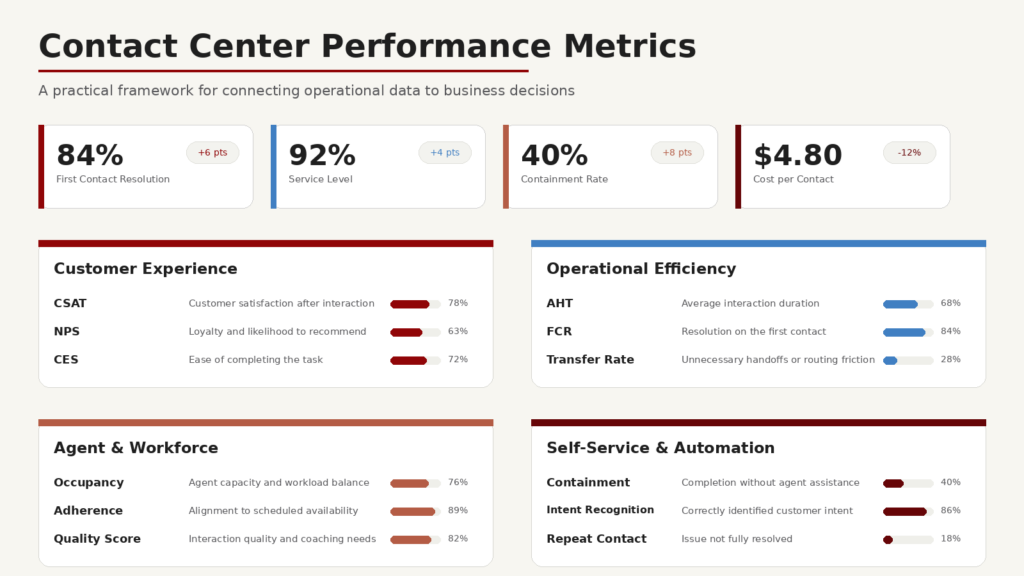
The right metrics depend on the organization’s goals, channels, customer journeys, and operating model. However, most contact centers should establish a consistent set of core KPIs and contact center performance metrics across customer experience, operational efficiency, agent performance, and self-service.
| Metric | What It Measures | Why It Matters |
| Customer Satisfaction Score (CSAT) | Customer satisfaction after an interaction | Helps assess whether customers are satisfied with the support experience |
| Net Promoter Score (NPS) | Customer willingness to recommend the organization | Provides a broader view of loyalty and brand perception |
| Customer Effort Score (CES) | How easy or difficult it was for a customer to complete a task | Helps identify friction in the journey |
| First Contact Resolution (FCR) | Percentage of issues resolved in the first interaction | Indicates whether customers are getting complete answers without repeat contacts |
| Abandonment Rate | Percentage of customers who disconnect before reaching support | Highlights wait-time, routing, or demand issues |
| Metric | What It Measures | Why It Matters |
| Average Handle Time (AHT) | Average duration of an interaction, including talk, hold, and after-call work | Helps manage efficiency, staffing, and complexity |
| Service Level | Percentage of contacts answered within a target threshold | Helps assess responsiveness and staffing alignment |
| Call, Chat, or Email Volume | Number of inbound interactions by channel | Supports forecasting, staffing, and trend analysis |
| Cost per Contact | Average cost to handle an interaction | Connects operational performance to financial impact |
| Transfer Rate | Percentage of interactions transferred to another agent, queue, or team | Identifies routing issues, training gaps, or process complexity |
| Metric | What It Measures | Why It Matters |
| Occupancy or Utilization | Percentage of agent time spent handling work | Helps balance productivity and burnout risk |
| Schedule Adherence | Alignment between planned and actual agent availability | Supports workforce management effectiveness |
| Agent Turnover | Rate at which agents leave the organization | Indicates employee experience, training, and retention challenges |
| Quality Scores | Evaluation of agent interactions against defined standards | Helps identify coaching and process improvement opportunities |
Self-Service and Automation Metrics
| Metric | What It Measures | Why It Matters |
| Self-Service Rate | Percentage of customers who use automated or digital self-service | Indicates adoption of automation channels |
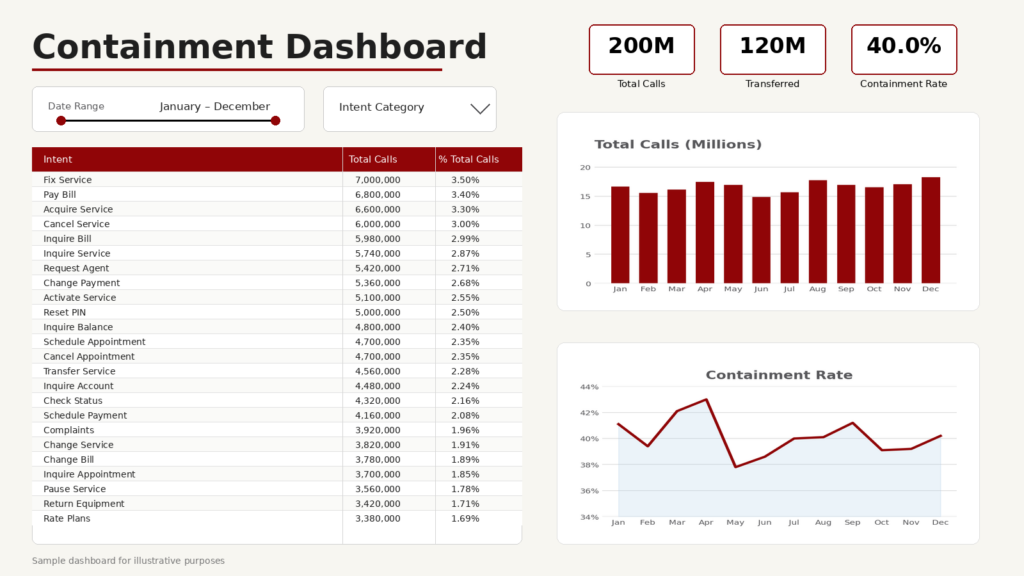
| Containment Rate | Percentage of customers who complete their task without agent assistance | Helps quantify automation effectiveness and cost savings |
| Intent Recognition Rate | How often the system correctly identifies customer intent | Helps evaluate IVR, IVA, chatbot, and voice AI performance |
| Escalation Rate | Percentage of automated interactions that require human support | Identifies failure points in self-service design |
| Repeat Contact Rate | Percentage of customers who contact again for the same or related issue | Helps determine whether the experience truly resolved the need |
For a deeper look at how to measure IVR and IVA performance specifically, including containment, self-service completion, intent recognition, transfers, repeat contacts, and executive dashboard design, read our guide to IVR metrics and executive dashboards
Contact center metrics can be misleading when viewed in isolation. The same metric can signal success or failure depending on the context.
For example, an increase in Average Handle Time (AHT) is not always negative. If a new IVR or virtual agent successfully contains simple interactions, agents may be left handling more complex customer issues. In that scenario, AHT may increase while the overall customer experience and cost profile improve.
Similarly, a high containment rate is not always a win. If customers are contained but do not resolve their issue, they may call back, abandon the process, or experience greater frustration. Containment should be evaluated alongside repeat contact, task completion, customer effort, satisfaction, and other contact center performance metrics.
This is why organizations need more than a list of KPIs. They need shared definitions, clean data, business context, and an operating model for interpreting results.
Contact center analytics are only as strong as the data behind them. Many organizations struggle because contact center data is spread across multiple platforms, including:
When these systems are disconnected, reporting becomes fragmented. Teams may define the same metric differently. Leaders may receive conflicting numbers. Analysts may spend more time reconciling data than generating insight.
A strong contact center data foundation should address:
Without this foundation, contact center dashboards may look polished while still producing unreliable conclusions.
Kenway’s Contact Center Solutions practice partners closely with our Data & Analytics practice to help clients turn fragmented contact center data into scalable, trusted reporting. In one engagement with a Fortune 50 telecommunications provider, Kenway modernized the client’s contact center data environment using Azure Synapse and Power BI, enabling faster KPI reporting, improved decision-making, and a reported 90% reduction in overall infrastructure spend.
A modern reporting architecture should help teams move from raw activity data to actionable insight and more effective contact center reporting.
A typical structure includes:
The architecture does not need to be overly complicated. It needs to be intentional. Organizations should start by answering a few practical questions:
When reporting architecture starts with business questions, it is much more likely to produce useful insights and more reliable contact center performance metrics.
Most modern CCaaS platforms include built-in reporting capabilities. These native tools are useful for operational visibility, especially when teams need quick access to platform-specific metrics and contact center performance metrics.
However, native reporting may not be enough when an organization needs to combine contact center data with CRM, workforce, quality, finance, digital, marketing, or product data. In those cases, third-party Business Intelligence tools such as Power BI, Tableau, Qlik, or similar platforms can provide more flexible analysis, visualization, and contact center dashboards.
When evaluating reporting and analytics tools, consider:
No two contact centers operate the same way. The tool should support dashboards and reports that reflect your channels, customer journeys, operating model, and executive priorities.
The tool should connect with the systems that matter most, including CCaaS, CRM, IVR, IVA, WFM, QA, and enterprise data platforms.
Reporting needs often grow over time. The solution should support increasing data volume, additional users, new channels, and more advanced analytics.
Contact center data often includes sensitive customer information. Reporting tools must support appropriate access controls, data protection, auditability, and compliance requirements.
Executives, supervisors, analysts, and agents need different levels of detail. A strong solution should make insights easy to consume without oversimplifying the underlying data.
Tool selection should account for the organization’s existing technology ecosystem. If the enterprise already relies heavily on Microsoft, Salesforce, AWS, Google Cloud, or another ecosystem, that context should influence reporting architecture decisions.
The best reporting tool is not always the one with the most features. It is the one that fits the organization’s data environment, decision-making needs, and operating model.
One common mistake is trying to build a single dashboard for every user. Executives, operations leaders, supervisors, analysts, and technology teams need different views of the same underlying data and contact center performance metrics.
| Audience | What They Need | Example Dashboard Focus |
| Executives | Business outcomes, trends, risk, and ROI | Cost per contact, CSAT, NPS, containment, service level, strategic initiative performance |
| Contact Center Leaders | Operational performance and improvement priorities | Volume, staffing, abandon rate, FCR, AHT, transfers, channel mix |
| Supervisors | Team and agent-level coaching opportunities | Agent performance, QA scores, adherence, escalations, resolution rates |
| Product or Journey Owners | Customer friction and journey performance | Intent performance, self-service completion, repeat contacts, drop-off points |
| Technology Leaders | Platform health, integrations, and defects | System errors, routing failures, data latency, platform adoption, incident trends |
| Analysts | Granular data exploration | Drilldowns by segment, channel, intent, queue, time period, and customer type |
A strong reporting program designs contact center dashboards around decisions, not just data availability.
Even organizations with sophisticated platforms can struggle to generate meaningful insight. Common mistakes include:
The solution is not simply more reporting. The solution is better reporting, stronger governance, and a clearer connection between insights and business outcomes.
As organizations introduce AI agents, virtual assistants, agent assist, speech analytics, automated quality management, and predictive routing, the need for reliable analytics and contact center performance metrics becomes even more important.
AI and automation initiatives require a strong measurement framework. Leaders need to understand whether automation is improving the customer experience, reducing effort, increasing containment, improving resolution, or simply shifting problems to another channel.
Analytics can help answer questions such as:
Without strong analytics, AI investments can become difficult to govern and even harder to scale. With the right analytics foundation, organizations can test, monitor, and optimize AI-enabled experiences with greater confidence.
Kenway Consulting helps organizations transform contact center data into practical insight and measurable improvement.
We bring together contact center expertise, data and analytics capabilities, technology implementation experience, and strategic advisory support to help clients design reporting and analytics solutions that fit their business.
Our work may include:
Many organizations see the contact center as a cost center. We help clients reframe it as a strategic source of customer insight, operational improvement, and business value. The right reporting foundation does more than show what happened. It helps leaders understand what to do next using stronger reporting, analytics, and contact center dashboards.
What is contact center reporting?
Contact center reporting is the process of collecting and presenting contact center data so teams can monitor performance, understand customer interactions, and make more informed operational decisions through reporting and contact center dashboards.
What is contact center analytics?
Contact center analytics is the analysis of contact center data to identify trends, explain performance, forecast future needs, and recommend actions that improve customer experience and operational efficiency.
What is the difference between contact center reporting and analytics?
Reporting shows what happened. Analytics helps explain why it happened, what may happen next, and what the organization should do about it.
What are the most important contact center metrics?
Common contact center performance metrics include Average Handle Time, First Contact Resolution, Customer Satisfaction, Net Promoter Score, Service Level, Abandonment Rate, Occupancy, Cost per Contact, Transfer Rate, Self-Service Rate, and Containment Rate.
Why is data quality important for contact center reporting?
Data quality is critical because incomplete, inconsistent, or inaccurate data can lead to misleading reports and poor decisions. Reliable reporting requires clear data sources, consistent definitions, and strong governance.
Should we use native CCaaS reporting or a third-party BI tool?
Native CCaaS reporting can be useful for platform-specific operational visibility. A third-party BI tool is often better when the organization needs to combine contact center data with CRM, workforce, quality, finance, digital, or enterprise data.
How can contact center analytics improve customer experience?
Analytics can identify friction points, repeat contact drivers, routing issues, self-service failures, training gaps, and process inefficiencies. These insights help organizations prioritize changes that reduce customer effort and improve resolution.
How does contact center reporting support AI and automation?
Reporting and analytics help organizations measure whether AI and automation are working as intended. They can track containment, escalation, task completion, customer satisfaction, accuracy, and operational impact.