

For many customers, the Interactive Voice Response (IVR) or Intelligent Virtual Assistant (IVA) is the first experience they have with a company’s contact center. Before they speak with an agent, open a case, or complete a service request, they are asked to navigate prompts, explain their intent, authenticate themselves, and trust that the system will get them to the right place.
That first experience matters. A well-designed IVR can help customers complete simple tasks quickly, reduce unnecessary agent demand, and create a more efficient service model. A poorly measured IVR can do the opposite. It can hide customer frustration, create repeat contacts, send callers to the wrong queue, and make leaders believe automation is working simply because fewer customers reached an agent.
This is why IVR metrics and executive dashboards are so important. They help organizations see beyond call volume and understand whether the IVR is helping customers accomplish what they came to do.
The most effective IVR reporting does not just answer, “How many calls did we receive?” It answers more meaningful questions: Are customers completing their tasks? Are intents being recognized correctly? Are callers being routed to the right destination? Are transfers decreasing for the right reasons? Are customers calling back because the automated experience failed to resolve their issue? When those questions are answered clearly, IVR reporting becomes more than a dashboard. It becomes a management tool for improving customer experience, reducing cost, and making smarter decisions about automation.
Most contact center leaders already track metrics like Average Handle Time, Service Level, Occupancy, First Contact Resolution, and Customer Satisfaction. Those metrics matter, but they tend to focus on what happens once a customer reaches an agent or after an interaction is complete.
IVR and IVA performance requires a different lens. The most important moments often happen before the agent is involved. Did the caller state an intent clearly? Did the system recognize it? Did the customer complete the task in self-service? Did they opt out? Did they abandon? Did they transfer to the right queue? Did they call back later because the original issue was not actually resolved?
That distinction is important because IVR performance sits at the intersection of customer experience, routing, automation, data, and operational efficiency. A traditional contact center report may show that agent volume declined, but an IVR dashboard should help explain why. Was it because self-service improved? Because customers gave up? Because calls were misrouted? Because a new prompt changed behavior?
Without IVR-specific reporting, leaders are left with partial visibility. They can see what happened downstream, but not enough about the customer journey that shaped the outcome. For a broader view of how reporting, dashboards, and performance metrics fit together across the full contact center, read our contact center analytics and reporting guide.
One of the most common reporting mistakes happens before the first call ever hits production: the IVR is designed, configured, tested, and launched, and only then does someone ask, “How are we going to measure this?”
By that point, it may already be too late to capture the right data cleanly. Intent outcomes may not be standardized. Transfer reasons may be unclear. Containment may be defined differently across teams. Session data may not connect to CRM records, agent dispositions, call transcripts, or repeat contact behavior. The dashboard may eventually get built, but the foundation underneath it is incomplete.
IVR reporting should be designed during discovery and implementation, not after go-live. The organization should know what success looks like before the experience is launched. That means aligning business, operations, technology, and analytics teams around the questions the reporting needs to answer.
For example, if the goal is to increase containment, the team needs to define whether containment simply means “no agent reached” or whether it means “the customer completed the intended task.” If the goal is to reduce transfers, the team needs to define which transfers are avoidable and which are appropriate. If the goal is to improve intent recognition, the team needs to capture enough data to understand which intents are failing and why.
The best time to design IVR reporting is when the IVR experience itself is being designed. Otherwise, organizations risk building dashboards that look polished but fail to explain what is really happening.
There is no universal set of IVR metrics that works for every organization. The right metrics depend on the customer journeys, channels, business goals, and automation strategy. Still, most organizations need a balanced view across volume, containment, self-service success, routing, intent recognition, and customer effort.
Call volume is the natural starting point. It helps leaders understand how many customers enter the IVR or IVA experience, how demand changes over time, and which intents drive the most activity. But volume by itself does not tell the full story. A high-volume intent may be a good candidate for automation, or it may be a sign of upstream confusion, product issues, billing problems, or communication gaps.
Containment rate is another common IVR metric, but it is also one of the easiest to misinterpret. Containment measures the percentage of interactions that do not require agent assistance. That can be useful for understanding automation impact and potential cost savings. But containment should never be treated as a standalone measure of success. A customer who hangs up without reaching an agent may be “contained” in a technical sense, but that does not mean their issue was resolved.
That is why self-service success rate is often more valuable. It measures whether the customer completed a specific task, such as making a payment, checking order status, scheduling an appointment, or getting account information. This creates a clearer distinction between successful automation and unresolved deflection.
Intent recognition rate is especially important for speech-enabled IVRs, conversational IVAs, and AI-powered service experiences. If the system cannot correctly identify what the customer wants, the rest of the journey is compromised. Poor intent recognition can lead to repeated prompts, misroutes, unnecessary transfers, and lower customer confidence in self-service.
Transfer rate, agent request rate, abandonment rate, opt-out rate, and repeat contact rate round out the picture. Together, these metrics help show whether customers are moving through the experience smoothly or encountering friction that sends them elsewhere. A strong IVR dashboard should not treat these as isolated numbers. The value comes from connecting them. For example, if containment increases while repeat contacts also increase, the organization may be deflecting calls without resolving issues. If agent request rate rises after a prompt change, the new design may be confusing customers. If transfer rate spikes for one intent, the root cause may be a routing rule, an incomplete integration, or a mismatch between customer language and system design.
Containment is often positioned as the headline metric for IVR performance. It is easy to understand, easy to trend, and easy to connect to cost savings. But it can also create false confidence.
A higher containment rate is not automatically a better outcome. If customers complete their tasks, avoid repeat contacts, and report lower effort, then higher containment likely reflects meaningful improvement. If customers hang up, call back, switch channels, or escalate later, then containment may be masking a poor experience.
The same logic applies to Average Handle Time. Leaders often view higher AHT as a negative. But if the IVR is successfully resolving simple interactions, agents may be left handling more complex issues that naturally take longer. In that scenario, higher AHT may not indicate declining agent performance. It may indicate that the service model is shifting in the right direction.
Transfer rate requires similar nuance. The goal is not to eliminate every transfer. Some interactions should be escalated to a specialist, a licensed agent, a retention team, or a complex support queue. The real question is whether the transfer was accurate, necessary, and supported by the right context.
This is where Kenway often sees organizations get stuck. The metric may be technically accurate, but the interpretation is incomplete. Contact Center reporting should help leaders understand not just whether a number changed, but whether that change improved the customer journey and the business outcome.
An executive IVR dashboard should not be a data dump. Executives do not need every prompt-level detail or every system event. They need a clear view of performance, trend, risk, and business impact.
A strong executive dashboard typically starts with a few key questions. Is the IVR improving customer experience? Is self-service reducing unnecessary agent demand? Are customers completing the tasks they came to complete? Are transfers, abandons, and repeat contacts trending in the right direction? Which intents create the most friction? Where should the organization invest next?
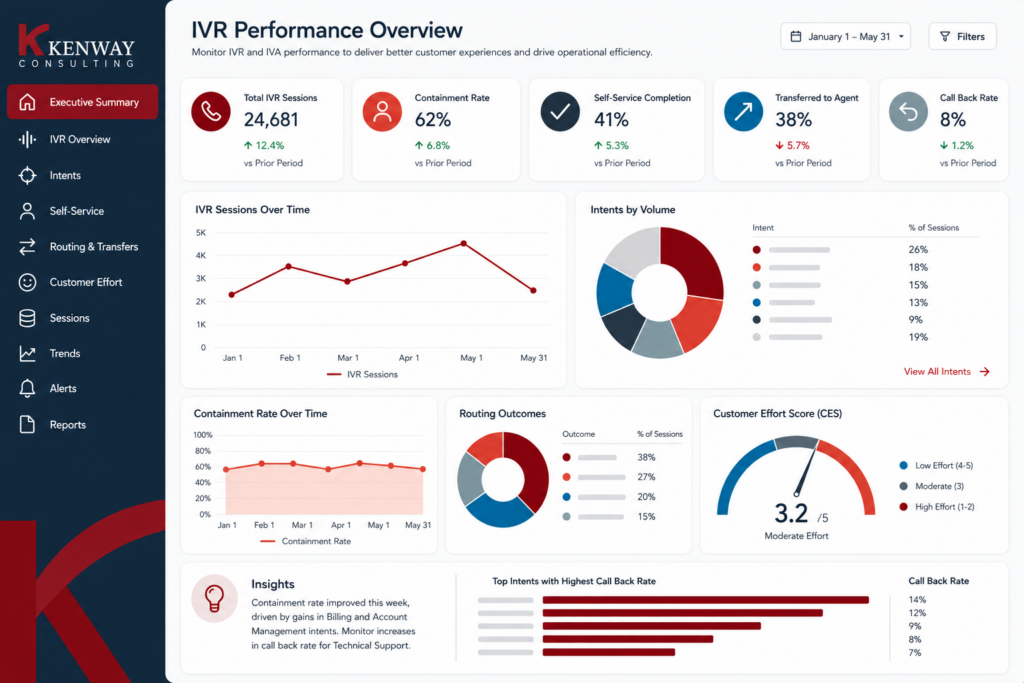
The dashboard should then organize metrics around those decisions. At the executive level, the most useful view often includes total IVR volume, top intents, containment rate, self-service success, transfer rate, agent request rate, abandonment, repeat contact, intent recognition, and estimated cost impact. Trend lines and baselines are especially important because they help leaders see whether performance is improving over time or drifting away from expectations.
The same dashboarding strategy should also support drill-downs for operational and technology teams. An executive may need to know that transfer rate increased for a high-volume billing intent. An operations leader may need to know which queue received the transfers. A product or journey owner may need to know which prompt created the friction. A technology team may need to know whether a backend integration failed.
In other words, the dashboard should serve multiple levels of decision-making. The executive view should summarize outcomes. The operational view should explain root causes. The technical view should help teams fix the issue.
IVR reporting is often thought of as a retrospective exercise: teams review yesterday’s volume, last week’s containment, or last month’s transfer trends. That historical view is valuable, but it is not always enough.
For high-volume or complex contact centers, teams also need real-time observability. A sudden spike in no-match rates, a drop in authentication success, or an unexpected increase in transfers can quickly affect thousands of customers. If those issues are only discovered in a monthly report, the damage has already been done.
Real-time alerts can help teams respond faster when performance changes unexpectedly. For example, an alert might flag that a specific intent is suddenly transferring at twice its normal rate, or that abandonment has increased after a new prompt was deployed. Another alert might reveal that a backend system outage is preventing customers from completing a self-service task.
This is especially important as organizations introduce more AI-enabled self-service experiences. Conversational systems are more flexible than traditional menu-based IVRs, but they also require more active monitoring. Leaders need visibility into how customers are interacting with the system, where the model is misunderstanding intent, and whether the experience is improving or degrading over time.
A mature IVR reporting strategy combines historical dashboards, trend analysis, and real-time alerts. Together, they help teams learn from the past, manage the present, and improve the future.
A dashboard is only as reliable as the data behind it. Many IVR reporting challenges are not visualization problems; they are data foundation problems.
IVR and IVA data often lives across multiple systems. The IVR platform may capture prompts, intents, and session outcomes. The CCaaS platform may capture routing and call handling. The CRM may capture customer profile, case, and resolution details. Workforce and quality platforms may capture agent performance. Speech analytics or transcription tools may capture customer language and sentiment. Enterprise BI platforms may be needed to connect it all.
The most valuable insights usually come from combining these sources. Containment becomes more meaningful when connected to repeat contact behavior. Transfers become more actionable when connected to queue outcomes and agent dispositions. Intent recognition becomes more useful when connected to transcripts, prompt design, and downstream resolution.
This is why IVR reporting requires more than a dashboard developer. It requires alignment across data ownership, metric definitions, system integrations, security, and governance. Teams need to know where the data comes from, how it is transformed, who owns it, how often it refreshes, and what limitations should be considered when interpreting the results.
For organizations with sensitive customer information, authentication events, regulated interactions, or complex enterprise data environments, governance is not optional. It is part of making the reporting trustworthy.
The real value of IVR metrics is not the report itself. It is the improvement cycle the report enables.
A strong operating model uses IVR reporting to identify friction, prioritize changes, implement improvements, and measure the impact. If no-match rates are high, the team may need to adjust prompts, improve speech recognition, or retrain intents. If containment is low for a high-volume task, the organization may need better backend integration or a simpler customer journey. If transfers are high, the issue may be routing logic, unclear prompts, or a mismatch between customer language and system categories.
This cycle should be ongoing. IVR and IVA performance changes over time as customer behavior shifts, products change, policies evolve, and new self-service capabilities are introduced. A flow that worked well six months ago may become less effective after a billing change, new product launch, system migration, or marketing campaign.
The best organizations treat IVR reporting as part of continuous improvement. They do not just monitor performance; they use performance data to make the experience better.
Even mature organizations can struggle with IVR reporting. The most common problems usually come from measuring the wrong thing, interpreting the right thing incorrectly, or failing to connect the data to action.
A few mistakes show up often:
These mistakes are fixable, but they require a shift in mindset. IVR reporting should not be treated as a static artifact. It should be treated as a decision-support capability.
Kenway Consulting helps organizations turn IVR and IVA data into actionable insight and measurable performance improvement.
Our Contact Center Solutions team works with clients to understand the customer journey, define the right IVR metrics, evaluate existing reporting, identify friction points, and design dashboards that support better decision-making. We also partner closely with our Data & Analytics, and Salesforce practices when the solution requires deeper data integration, BI development, governance, or cross-platform delivery.
That combination matters. IVR performance is rarely just an IVR issue. It often depends on CRM data, routing logic, backend integrations, agent workflows, reporting architecture, and operating model discipline. Kenway helps clients connect those pieces so they can move from fragmented reporting to practical insight.
Many organizations invest in IVR and IVA technology to reduce cost and improve customer experience, but technology alone does not create the outcome. Success depends on knowing what to measure, how to interpret it, and how to turn those insights into action. With the right IVR metrics and executive dashboards, organizations can better understand customer behavior, improve automation, reduce unnecessary transfers, and create more effective service experiences.
IVR metrics are performance measures that help organizations understand how customers move through an Interactive Voice Response or Intelligent Virtual Assistant experience. Common IVR metrics include call volume, containment rate, self-service success rate, intent recognition rate, transfer rate, abandonment rate, opt-out rate, and repeat contact rate.
An IVR dashboard is a reporting view that shows how an IVR or IVA is performing. It typically includes metrics such as total calls, top intents, containment rate, transfer rate, agent request rate, abandonment rate, intent recognition, self-service completion, and repeat contacts.
Containment rate measures the percentage of interactions completed without agent assistance. It is useful for understanding automation impact, but it should be evaluated alongside self-service success, repeat contact, customer effort, and satisfaction.
Containment measures whether a customer avoided agent assistance. Self-service success measures whether the customer actually completed a task. Self-service success is usually a stronger indicator of whether automation is creating value for the customer.
Executives should track IVR metrics that connect to customer experience, cost, and business impact. These often include total volume, containment rate, self-service success rate, transfer rate, repeat contact rate, intent recognition rate, abandonment rate, and estimated cost savings.
IVR reporting should be designed before go-live because key data points, metric definitions, transfer reasons, intent outcomes, and system integrations need to be planned in advance. If reporting is added after launch, organizations may lack the data needed to measure performance effectively.
IVR dashboards can help reduce transfers by identifying which intents, prompts, flows, or routing rules are sending customers to the wrong destination. Teams can then improve routing logic, prompt design, self-service options, or agent skill alignment.
IVR metrics improve customer experience by helping teams identify where customers get stuck, abandon, repeat themselves, opt out, or fail to complete their task. These insights help organizations reduce effort and improve the design of automated experiences.