Excuse Me, Can I Power BI your KPI’S?

On March 13, 2018, Kenway unveiled four new corporate strategies, one of which is something we call “Company Performance Transparency.” Up until that point, Kenway’s core strategies focused on “hiring smart people” and “being good and being honest.” Principles we still live by, but ones that are not exactly specific or measurable KPI’s.
![]()
Most companies have some sort of performance strategy, as well as Key Performance Indicators (KPI’s) that align. Terms like “Net Promoter Score,” “Conversion Rate,” and “Average Customer Profitability” are commonplace. If you read Sarah Welch’s Net Promoter Score (NPS) blog or Tim Olson’s case study on the subject, you know Kenway has helped clients develop, choose and report on KPI’s. Well…guess what our Managing Director and CEO asked us to do?

The following is a summary of the steps we took to get started with our internal metrics and KPI reporting process, which is still a work in process.
STEP 1 – Define Your Metrics
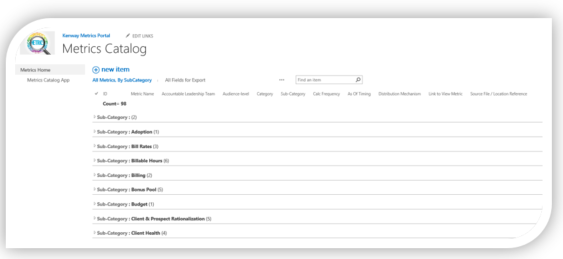
We created a Metrics Catalog app using a Microsoft SharePoint List (i.e., a point-and-click database of metrics) to help ensure there was a “single source of truth” for metric names, definitions, and other metrics metadata (e.g., owner, category, audience, etc.).
Vocabulary is important when it comes to metrics. Before you start defining, make sure you understand the difference between a measure, a metric, a KPI and a dimension. For example, Revenue Growth by Industry might be a KPI that consists of the metric, “Revenue Growth,” and the dimension, “Industry.” (h/t Jonathan Taylor for a great article on the vernacular.)
STEP 2 – Identify Possible Quick Wins and Prototype Them
Metrics definition is a labor-intensive and seemingly never-ending effort, so it’s important to avoid falling into the “paralysis by analysis” trap. Take a page from Design Thinking, Lean Startup and Nike … just do it! Don’t try to get everything perfect the first time around – it’s a prototype.
We identified metrics where definitions were complete (don’t skip the definitions step) and, we felt, were ready to be turned into prototyped reports or dashboards. The result was the dashboard built using Microsoft’s Power BI tool. This dashboard allows us to analyze Kenway Consulting’s hours over time (the X-axis) and by industry (the colors).
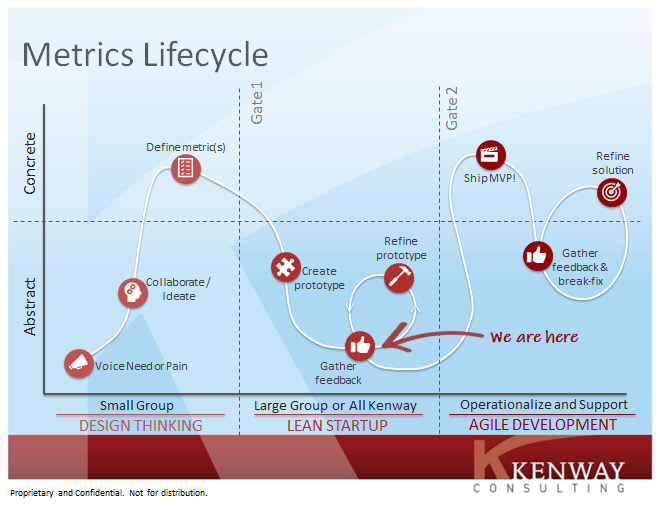
STEP 3 – Operationalize Your Prototype for the Long Term
The next step involves turning your prototype into a product or app that can live on for however long you need it to. We’re not there yet for the metric shown above, but the entire process and approach we follow for these types of projects is illustrated below. As you can see, we are on the “Gather feedback” step.
Do you have feedback? We’d love to hear it! Email us at info@kenwayconsulting.com or find us on LinkedIn.
Related INSIGHTS


How Can We Help?
REQUEST A CONSULTATION