Why Higher Education Digital Transformation Projects Stall — And How Universities Can Regain AlignmentRead More
Contact Center Analytics and Reporting: A Guide to Better Decisions, Dashboards, and Data StrategyRead More
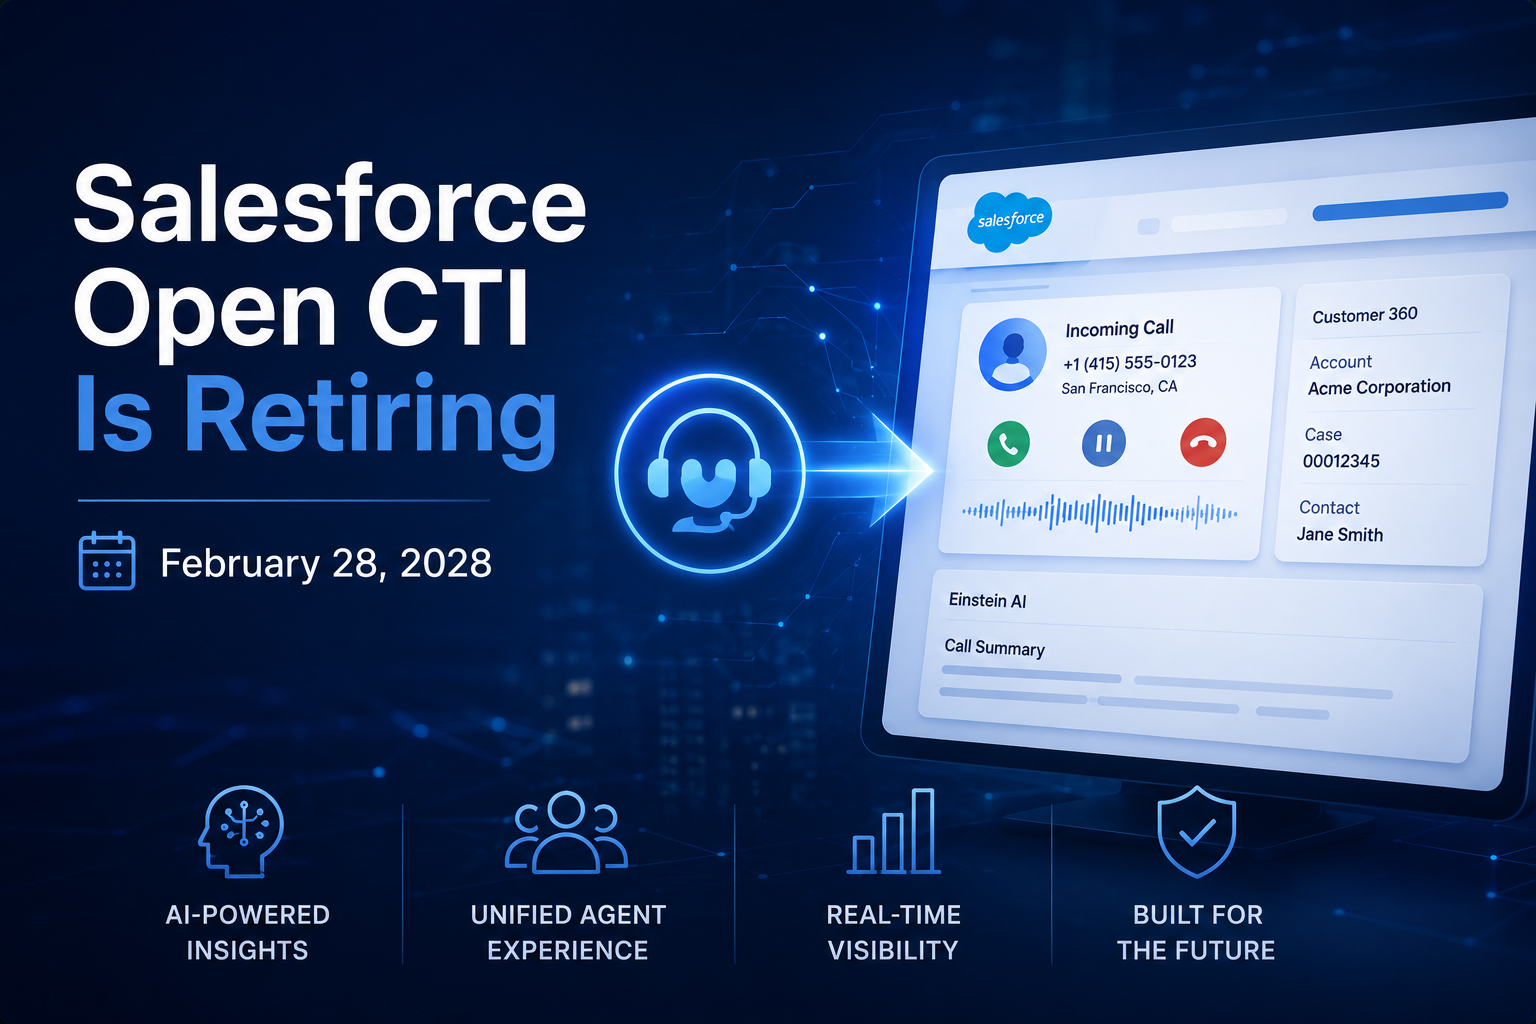
Salesforce Open CTI Is Retiring: What It Means for Your Contact Center and How to Plan Your MigrationRead More
Why Higher Education Digital Transformation Projects Stall — And How Universities Can Regain AlignmentRead More